What's in this article
- Fixed vs variable costs: the split that explains why mileage is not the whole story
- The full cost breakdown: what each component typically contributes
- Depreciation: the hidden largest cost
- Fuel
- Insurance
- Vehicle Excise Duty (VED / road tax)
- Servicing and MOT
- Tyres
- Brakes and ad hoc repairs
- Annual running costs by vehicle type: three scenarios at 10,000 miles
- The cost per mile: what the full number looks like
- New vs used: how the cost picture changes
- Situational costs: parking, tolls, and clean-air zones
- How to estimate your own annual figure
At 10,000 miles a year, a realistic all-in running cost for a used petrol family car in the UK is often around £4,900 to £5,300 once you include fuel, insurance, servicing, tyres, VED, MOT, repairs, and depreciation. Fuel is often only around a quarter of that total. The rest is fixed or semi-fixed cost that most drivers underestimate because it does not arrive at a pump every week.
This article breaks down the components, shows them by vehicle type, and gives you the framework to calculate your own number.
Key takeaways
- For most UK drivers in most cars, fuel accounts for less than half the total annual running cost at 10,000 miles. Depreciation is typically the single largest item.
- Insurance and VED are fixed annual costs. Fuel and tyres scale most directly with mileage. Depreciation is more time-based than fuel but still mileage-sensitive, so it sits between the two. The split matters for deciding whether a more expensive car is worth it.
- Depreciation is the cost most drivers underestimate because it is not a regular payment. A car bought for £15,000 and sold three years later for £9,000 has depreciated by £2,000 per year.
- Insurance is one of the most variable items. The ranges in this article are starting points; your own quote will reflect your age, location, and driving history.
- A newer car typically has lower repair risk but higher depreciation exposure. An older car has lower depreciation loss but rising repair probability. Neither is universally cheaper.
Fixed vs variable costs: the split that explains why mileage is not the whole story
Running costs divide into broadly fixed, variable, and mileage-sensitive costs. Understanding which is which changes how you think about your car’s expense.
Broadly fixed annual costs: insurance premium and Vehicle Excise Duty (road tax).
Variable costs: fuel (directly proportional to miles driven) and tyres (wear rate scales with mileage). Servicing, repairs, and depreciation sit between the two because they depend on both time and use.
Depreciation is best treated as a semi-fixed cost rather than a purely fixed one. Age, condition, and market trends matter, but mileage does too, so a car covering 20,000 miles a year will usually depreciate more than the same car covering 5,000.
The implication: a driver considering a more expensive car with better fuel economy may find the fuel saving is outweighed by higher insurance, higher depreciation, or finance interest and fees. The comparison requires the full picture.
The full cost breakdown: what each component typically contributes
Depreciation: the hidden largest cost
Depreciation is the difference between what a car is worth when you buy it and what it is worth when you sell or trade it in. If a car costs £18,000 new and is worth £13,500 after one year, it has depreciated by £4,500 in that year, equivalent to £375 per month or approximately 45p per mile at 10,000 miles.
Most drivers do not experience depreciation as a regular payment, so it does not feel like a cost. But when the lower-than-expected trade-in offer arrives, that is the depreciation. New cars lose the most in year one (often 15–25% of original value). After year three, depreciation slows. A used car bought at three or four years old has already absorbed the steepest curve.
Fuel
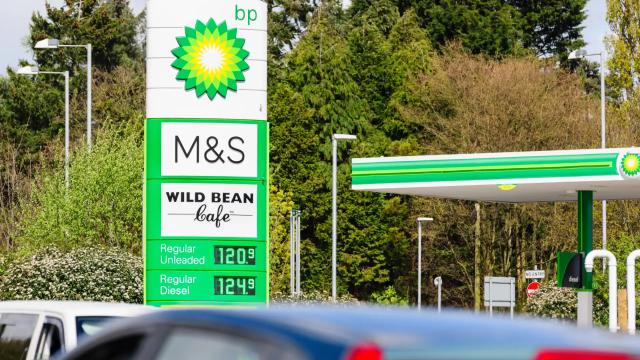
At 10,000 miles per year, fuel cost depends on your car’s real-world MPG and the fuel price. The formula: (10,000 ÷ mpg) × 4.546 × (pence per litre ÷ 100). Fuel is the most visible running cost and the most controllable. You can calculate your own cost per mile with current prices to see exactly what fuel costs you per mile.
Insurance
Insurance premiums vary more widely than any other item in this article. Key factors: driver age (young drivers pay significantly more), postcode, the specific vehicle, claims history, and policy tier. Any figure given here is a starting point. A 35-year-old with a clean licence in a competitive postcode may pay half the premium of a 22-year-old with a recent claim in an urban area, for the same car.
Vehicle Excise Duty (VED / road tax)
For cars registered on or after 1 April 2017, the first tax payment is linked to CO2 emissions, but from the second payment onwards the standard annual rate is £200 from 1 April 2026 for petrol, diesel, hybrid, and electric cars. Cars with a list price above £40,000, or above £50,000 for electric cars, can also pay the additional-rate supplement of £440 a year for five years. Current rates are available in the GOV.UK vehicle tax rate tables and should be checked against the relevant tax year.
Servicing and MOT
Most modern cars require annual servicing. At 10,000 miles a year, an annual service is typical. Costs vary by vehicle and garage type (franchised vs independent). MOT is a legal requirement from the car’s third birthday; the fee itself is modest but advisory and rectification work adds up on older vehicles.
Tyres
Tyre wear depends on driving style, tyre specification, and conditions. At 10,000 miles, a typical driver may replace one axle per year on average. Tyre costs vary by wheel size and brand tier.
Brakes and ad hoc repairs
Brake disc and pad life varies with driving style. Urban drivers wear brakes faster. Repair costs rise with vehicle age. For budgeting, a few hundred pounds a year is a sensible repairs contingency for an older mainstream car; more for complex or ageing vehicles, and less for newer cars still under warranty.
Annual running costs by vehicle type: three scenarios at 10,000 miles
The table below shows illustrative annual running costs at 10,000 miles in mixed UK driving for three efficient vehicle profiles, not class averages. Fuel costs in this table use the latest published GOV.UK weekly average petrol price, 158.01p/litre for the week commencing 13 April 2026. MPG assumptions are based on representative real-world examples rather than brochure figures: a Dacia Sandero-like budget hatchback at 47.1mpg, a Seat Leon 1.0 TSI-like petrol family hatchback at 51.8mpg, and a Toyota Yaris Cross-like full-hybrid crossover at 60.1mpg.
Insurance figures are indicative only for a mid-30s driver with a clean licence and average-risk postcode; obtain your own quote.
These figures are planning assumptions, not personalised quotations. They are designed to show cost structure honestly rather than pretend one universal annual running-cost number applies to every driver.
All figures are illustrative but grounded in current UK reference points: petrol at 158.01p/litre (week commencing 13 April 2026); current VED and MOT limits; representative efficient real-world MPG examples from road-test data; servicing assumptions from RAC full-service guidance; insurance ranges anchored to recent UK market averages and quote checks; and tyre assumptions based on current 15-inch, 16-inch, and 17-inch retail price guides. Depreciation figures are indicative for 3–4-year-old used cars.
Cost component | Budget petrol hatchback (efficient example) | Petrol family car (efficient example) | Hybrid crossover / small SUV (efficient example) |
|---|---|---|---|
Fuel | £1,525 | £1,387 | £1,195 |
Insurance (indicative range) | £550–£800 | £650–£950 | £700–£1,050 |
VED (road tax) | £200 | £200 | £200 |
Annual service | £190 | £260 | £290 |
MOT | £54.85 | £54.85 | £54.85 |
Tyres (annualised) | £160 | £220 | £280 |
Depreciation (annualised, indicative) | £1,000 | £1,600 | £2,200 |
Contingency / ad hoc repairs | £400 | £550 | £700 |
Total estimated annual cost | £4,080–£4,330 | £4,922–£5,222 | £5,620–£5,970 |
Per mile | 40.8–43.3p | 49.2–52.2p | 56.2–59.7p |
Per month | £340–£361 | £410–£435 | £468–£498 |
The cost per mile: what the full number looks like
The fuel cost per mile is the most visible component but typically not the largest. In the scenarios above, fuel accounts for roughly 12p to 15p of a total running cost of around 41p to 60p per mile. Depreciation, insurance, servicing and tyres make up the rest.
Broadly fixed costs spread more thinly at higher mileage. A driver covering 15,000 miles pays the same insurance and VED as one covering 10,000, but not necessarily the same depreciation, because higher mileage can reduce resale value further. The cost per mile often still falls because those annual costs are spread over more miles, while fuel and tyre costs scale up.
Quick conversions at 10,000 miles
Annual total ÷ 10,000 = cost per mile Annual total ÷ 12 = cost per month Cost per mile × daily mileage = daily all-in driving cost
Worked example assumptions: 10,000 miles a year, 51.8mpg real-world mixed driving, petrol at 158.01p/litre, insurance £800, VED £200, annual service £260, MOT £54.85, tyres £220, depreciation £1,600, repairs contingency £550.
Fuel cost = (10,000 ÷ 51.8) × 4.546 × 1.5801 = about £1,387.
Annual total = £1,387 fuel + £800 insurance + £200 VED + £260 service + £54.85 MOT + £220 tyres + £1,600 depreciation + £550 repairs contingency = about £5,072.
Per month = about £423. Cost per mile = about 50.7p. In this example, fuel is only about 27% of the annual total, which is why looking at fuel alone understates what 10,000 miles really costs.
New vs used: how the cost picture changes
A new car typically offers lower repair risk (manufacturer warranty for two to three years), lower service complexity initially, and higher certainty about the vehicle’s condition. Against this: higher depreciation in the first year (often 15–25% of original value), higher insurance in some cases, and a higher purchase price.
A used car bought at three to four years old has already absorbed the steepest depreciation. The buyer experiences lower depreciation per year but faces rising repair probability as the car ages further. Neither is universally cheaper. The comparison requires the full running cost picture, not just the purchase price or the fuel efficiency.
Situational costs: parking, tolls, and clean-air zones
These are real costs for some drivers and zero for others, which is why they are not in the main table.
Parking. Commuter parking, town centre parking, and residential permit costs vary enormously by location. A driver in central London may pay several thousand pounds per year. A driver in a rural town pays nothing.
Congestion and clean-air zone charges. The London Congestion Charge, ULEZ, and clean-air zones in other UK cities apply to specific routes and specific vehicles. If you regularly pass through these zones, add the applicable charges to your annual total.
Finance. If the car is on PCP, HP, PCH, or a personal loan, keep finance separate from the economic running-cost table. The main table already includes depreciation, so adding the full monthly repayment on top can mix cashflow with total cost and double-count the capital element. A cleaner approach is to add finance interest and fees as an extra ownership cost, or present monthly repayments separately as a cashflow view. If you are on PCP or PCH, also check the mileage allowance and any excess-mileage charge.
How to estimate your own annual figure
This is the most useful thing the article can give you: a method for calculating your own number rather than relying on a table that may not match your car, your mileage, or your insurance.
Seven steps to your annual driving cost
1. Calculate your annual fuel cost. Use your real-world MPG, your annual mileage, and today’s fuel price. Formula: (miles ÷ mpg) × 4.546 × (pence per litre ÷ 100). 2. Add your actual insurance premium (from your last renewal, not a guess). 3. Add your VED rate (check GOV.UK for your vehicle’s current rate). 4. Add annual servicing and MOT costs (use last year’s actual spend as a guide). 5. Estimate annual depreciation. Check your car’s current market value, then check what a one-year-older equivalent sells for. The difference is your approximate annual depreciation. 6. Add a contingency for unexpected repairs: 5–10% of vehicle value per year for a car over five years old. 7. Add any situational costs (parking, tolls, CAZ charges).
Sum the total. Divide by 12 for monthly cost, or by your annual mileage for cost per mile.
You can work out your fuel cost per mile with current local prices as the starting point for Step 1.
Keep reading
UK Petrol Price History: The 2020–2026 Price Shocks, Record Highs, and What They Mean for Drivers Today
UK petrol prices went through more in six years than in the previous two decades. The collapse of 2020, the record-breaking surge of 2022, and the slow retreat that followed left p...
What Happens When Oil Supply Is Disrupted, and Why Prices Spike Before Any Shortage Reaches You
When an oil supply disruption makes the news, crude prices often move within hours. UK pump prices usually follow within one to three weeks, not because the petrol on UK forecourts...
How Oil Is Transported Around the World, and Why a Distant Disruption Can Raise Your Fuel Costs
Most of the world’s crude oil travels by sea, through a small number of narrow straits and canals that handle enormous volumes of daily trade. When any of those chokepoints is thre...
PetrolSavings Editorial
Editorial Team
Explore fuel savings tools
Use calculators and local price searches to plan smarter journeys.
Prices and station info are refreshed continuously. Look for freshness timestamps when comparing fuel deals.