What's in this article
Most of the world’s crude oil travels by sea, through a small number of narrow straits and canals that handle enormous volumes of daily trade. When any of those chokepoints is threatened, crude prices move quickly, not because oil has actually stopped flowing, but because the market prices in the risk that it might. By the time a tanker crisis makes the news, the effect on UK pump prices may already be in motion.
This article explains how the transport system works, which routes matter most, and how freight costs, insurance costs and market anticipation feed into the price at your forecourt.
Freshness note: structural transport data in this article use EIA 1H25 chokepoint volumes and capacities; live conflict, shipping and insurance references are updated through 6 May 2026.
Key takeaways
- Most long-distance crude oil trade moves by sea on large tanker ships. Pipelines are used regionally and as chokepoint bypass routes.
- A small number of maritime chokepoints carry a disproportionate share of seaborne oil trade. In 1H25, the Strait of Hormuz carried 20.9 million b/d and the Strait of Malacca 23.2 million b/d, according to the EIA.
- Freight rates and war risk insurance premiums both spike when a shipping route becomes contested. Both costs raise the landed cost of crude reaching UK refineries and import terminals.
- Bypass pipelines can reduce the damage from a disruption, but they cannot fully replace a major sea route. Around Hormuz, Saudi Arabia's East-West pipeline and the UAE's Abu Dhabi pipeline provide bypass capacity, but that is still far smaller than the volume that normally moves through the strait.
- Transport disruptions do not affect all products equally. A crude-route disruption raises refinery input costs, while a refined-product route disruption can affect diesel, petrol and jet fuel pricing more directly.
How oil moves: three methods, and why sea dominates
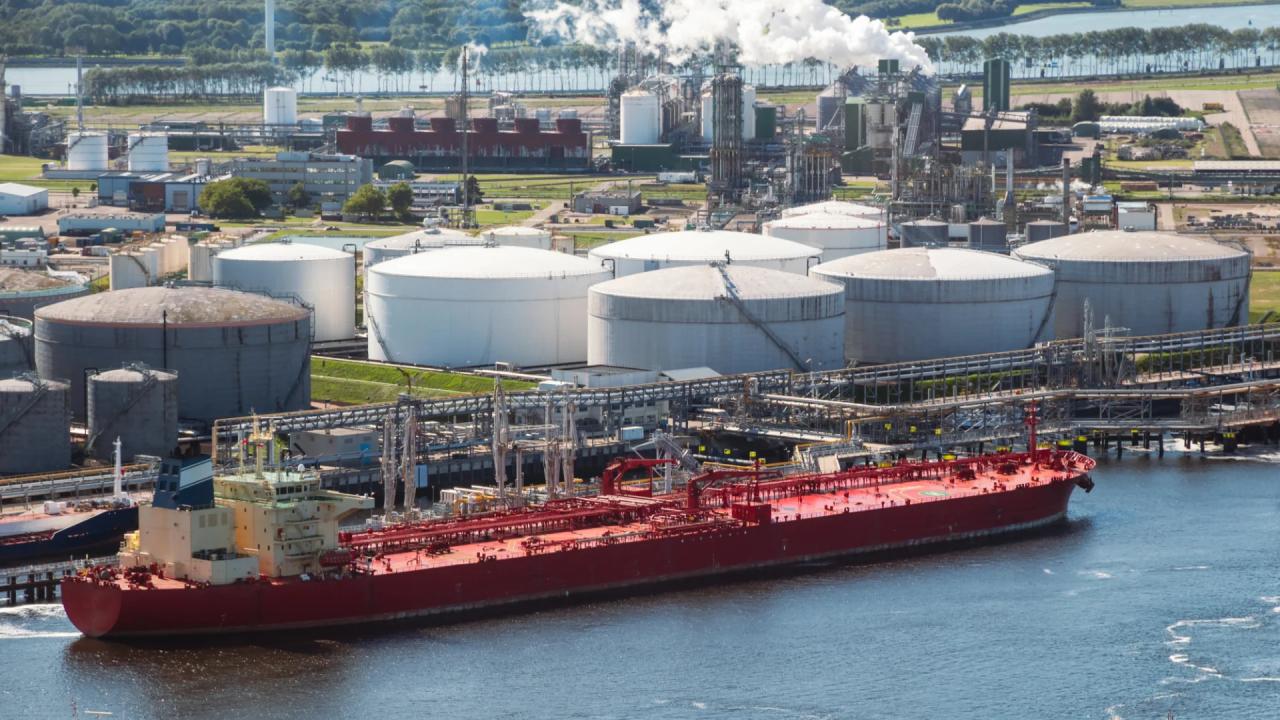
Tanker ships. The dominant long-distance method. Very Large Crude Carriers (VLCCs) and Ultra Large Crude Carriers (ULCCs) carry hundreds of thousands of tonnes of crude on routes from the Gulf, West Africa, and Russia to refineries in Europe, Asia, and North America. Tankers are flexible (they can be directed to any port with receiving infrastructure) but slow: a Gulf-to-Europe voyage takes two or three weeks, and the routes pass through geographic bottlenecks.
EIA estimates that about 79.8 million barrels a day, roughly 76% of total petroleum and other liquids supply, moved by sea in 1H25.
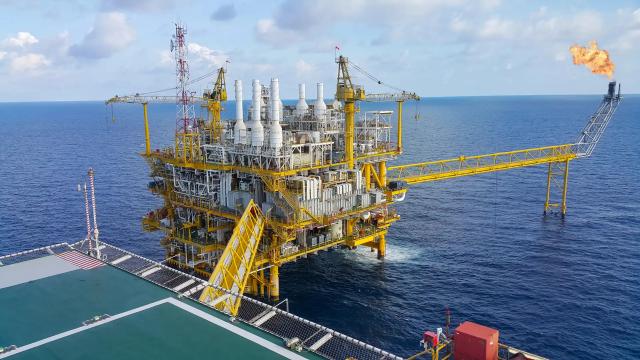
Pipelines. The cheapest method per barrel for overland transport, and critical infrastructure within producing regions. Current examples include Saudi Arabia’s East-West pipeline and large North American pipeline networks. Pipelines are fixed assets: they cannot be rerouted. They can also serve as chokepoint bypass routes, but only on a limited scale.
Rail and road. Used for smaller-scale, shorter-distance movements. Significantly more expensive per barrel. Not the primary method for intercontinental trade.
Directional comparison. Costs vary by route, market conditions, and vessel type.
Method | Volume capacity | Flexibility | Cost per barrel | Primary use |
|---|---|---|---|---|
Tanker ship (VLCC/ULCC) | Very high (2m+ barrels per voyage) | High: any port with infrastructure | Moderate (varies with freight rates) | Intercontinental crude and product trade |
Pipeline | High (continuous flow) | None: fixed route | Low (once built) | Regional; chokepoint bypass |
Rail | Moderate | Moderate: follows rail network | Higher | Secondary: where pipeline unavailable |
Road tanker | Low | High: any road | Highest | Last-mile: terminal to forecourt |
One useful distinction here: crude oil tankers and refined-product tankers are not the same market. Crude-route disruption mainly changes what refineries pay for input barrels. Product-route disruption can affect availability and wholesale pricing more directly.
The chokepoints: where the system is most vulnerable
Strait of Hormuz. The narrow 21-mile passage between Oman and Iran connects the Persian Gulf to the Gulf of Oman. According to the EIA, total oil flows through Hormuz averaged 20.9 million barrels per day in the first half of 2025, equal to about 20% of global petroleum liquids consumption and around one-quarter of seaborne oil trade. Those figures are a normal pre-war benchmark, not current traffic: the IEA says flows through Hormuz fell from around 20 mb/d before the war to just over 2 mb/d in March 2026. It is the single most critical oil chokepoint because it is the only sea exit route for most Gulf crude and product exports.
Saudi Arabia and the UAE have bypass infrastructure, but only on a limited scale. The EIA says Saudi Aramco's East-West pipeline and the UAE's Abu Dhabi pipeline together could provide about 4.7 million b/d of bypass capacity in the event of a disruption. Even if fully used, that is far short of the 20.9 million b/d that moved through Hormuz in 1H25.
Suez Canal and the SUMED pipeline. The Suez Canal connects the Red Sea to the Mediterranean and offers the shortest sea route from the Gulf to Europe. The EIA says about 4.9 million b/d of crude oil and petroleum products transited the Suez Canal and the SUMED pipeline in 1H25. Sailing around the Cape of Good Hope instead adds about 15 days to a Gulf-to-Europe voyage. The SUMED pipeline provides a partial crude-oil bypass parallel to the canal, with 2.5 million b/d of nameplate capacity, but it carries crude rather than refined products and does not remove the wider cost of disruption.
Bab-el-Mandeb. This strait sits between Yemen and Djibouti at the southern end of the Red Sea. Oil heading from the Gulf towards Suez must pass through it. EIA estimates about 4.2 million b/d also transited Bab-el-Mandeb in 1H25, after Red Sea attacks from late 2023 pushed some ships onto the longer route around the Cape of Good Hope.
Strait of Malacca. The passage between the Malay Peninsula and Sumatra is the primary route for oil moving from the Middle East and Africa to Asian refineries. EIA estimates total oil flows through Malacca averaged 23.2 million b/d in 1H25, making it the world's largest oil chokepoint by volume.
Table source: EIA, World Oil Transit Chokepoints (3 March 2026). Shares are derived from EIA 1H25 maritime trade and are rounded; route shares are not additive.
Chokepoint | Approx. daily oil flow | Share of global trade | Bypass options | Key vulnerability |
|---|---|---|---|---|
Strait of Hormuz | 20.9m b/d (1H25, EIA) | 26% of seaborne trade; about 20% of global liquids use | Saudi East-West and UAE Abu Dhabi pipelines; about 4.7m b/d combined bypass capacity | Only sea exit for most Gulf exports; alternatives can move only a portion |
Suez Canal / SUMED | 4.9m b/d (1H25, EIA) | 6% of seaborne trade | Cape of Good Hope route; SUMED crude pipeline (2.5m b/d) | Shortest Gulf-to-Europe route; rerouting adds about 15 days |
Bab-el-Mandeb | 4.2m b/d (1H25, EIA) | 5% of seaborne trade | Cape of Good Hope route | Gateway into the Red Seaand Suez route |
Strait of Malacca | 23.2m b/d (1H25, EIA) | 29% of seaborne trade | Lombok and Sunda/Makassar routes | Key route for Middle Easternand African oil into Asia |
Freight rates, insurance, and how disruption costs feed into prices
Freight rates. When a shipping route becomes contested or disrupted, demand for alternative routes and vessels rises while available tanker capacity on affected routes falls. This pushes charter rates up. A VLCC rate increase on Gulf-to-Europe routes can raise the cost of seaborne crude reaching Europe and the UK.
War risk insurance. When ships enter a declared war-risk zone, additional premiums apply. These can spike sharply during active attacks. Reuters reported on 2 March 2026 that major marine insurers said war-risk cover would be withdrawn for Iranian waters, the Gulf and adjacent waters from 5 March 2026. Reuters later reported on 20 March that Chubb launched a US-backed facility to provide war-risk cover for ships transiting Hormuz under certain conditions; on 7 April that premiums had surged by as much as 1,000% in some cases; and on 20 April that rates had risen again to around 3% of vessel value. This means the insurance story is not a one-off announcement but an evolving cost pressure during a disruption. Source: Reuters, 2 March 2026; Reuters, 20 March 2026; Reuters, 7 April 2026; Reuters, 20 April 2026.
Combined effect on landed crude cost. The landed cost of crude at a UK refinery or import terminal is the FOB (free on board) crude price plus freight plus insurance plus port charges. When freight and insurance both rise, the gap widens between the crude benchmark price and what UK refiners actually pay.
When disruption is announced versus when it actually happens
Oil markets do not wait for a physical shortage. Futures traders price probability. If the market sees a serious risk that Hormuz, Bab-el-Mandeb or the Suez route could be constrained for weeks or months, part of that expected disruption is priced into crude immediately.
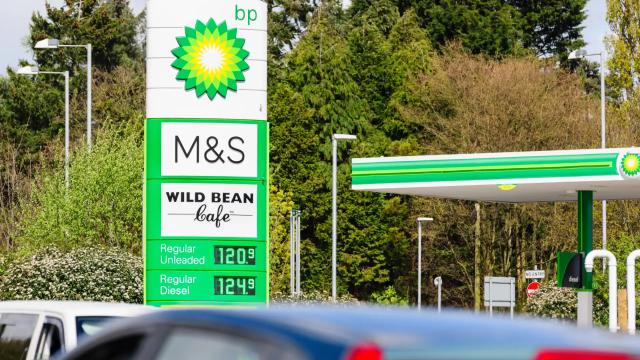
That is why a UK driver can see pump prices start moving before tankers have fully stopped sailing. The first move is financial, then freight and insurance costs lift the price of physical cargoes, and only after that do higher wholesale prices work through to the forecourt.
How transport disruptions reach UK pump prices
The chain from transport disruption to UK pump prices runs through several stages: crude futures repricing within hours or days, wholesale refined-product price movement over days, then retail pass-through over the course of a number of weeks. For a sustained disruption, visible movement at the pump usually comes with a lag rather than immediately.
Pass-through can also be asymmetric during volatile periods, especially in diesel.
Transport disruptions do not affect all products equally. Disruption to crude tanker routes raises refinery input costs. Disruption to refined-product routes can affect diesel, petrol and jet fuel pricing more directly, because the product itself is delayed or rerouted.
For seaborne crude imports, higher freight costs, insurance premiums and risk-adjusted crude prices raise the landed cost before fuel enters domestic distribution. The UK was also a net importer of petroleum products by 13.0 million tonnes in 2024, and UK refiners met only 54.9% of road diesel demand and 28.8% of jet fuel demand, so disruption to product routes matters as well as disruption to crude routes.
Europe receives only around 600 kb/d, about 4%, of Hormuz crude flows directly, but around 5 mb/d of oil products also moved through the Strait in 2025. The route still matters to UK drivers because global crude and product markets reprice when a major export corridor is threatened, and because the UK depends on imports for a significant share of diesel and jet fuel supply.
Once crude is refined or finished fuels are imported, products move around the UK by pipeline, coastal tanker, rail and road tanker before reaching forecourts.
Routes and landmarks
Jump straight to route planning or landmark fuel pages while you read.
Keep reading
UK Petrol Price History: The 2020–2026 Price Shocks, Record Highs, and What They Mean for Drivers Today
UK petrol prices went through more in six years than in the previous two decades. The collapse of 2020, the record-breaking surge of 2022, and the slow retreat that followed left p...
What Happens When Oil Supply Is Disrupted, and Why Prices Spike Before Any Shortage Reaches You
When an oil supply disruption makes the news, crude prices often move within hours. UK pump prices usually follow within one to three weeks, not because the petrol on UK forecourts...
Which Countries Produce the Most Oil, How the Rankings Are Measured, and Why It Moves the Price at Your Pump
Three countries, the US, Saudi Arabia, and Russia, produce more oil than any others. Together with the wider OPEC+ group they have significant influence over the global crude price...
PetrolSavings Editorial
Editorial Team
Explore fuel savings tools
Use calculators and local price searches to plan smarter journeys.
Prices and station info are refreshed continuously. Look for freshness timestamps when comparing fuel deals.