What's in this article
- How much do different countries actually produce, and how is it measured?
- What each producer extracts, and why the type of oil matters for prices
- United States: shale and the price-responsive producer
- Saudi Arabia: low cost, spare capacity, and the swing producer
- Russia: pipeline-dependent and hard to reroute
- Canada: oil sands and the slow responder
- Gulf producers: Hormuz-dependent and chokepoint-vulnerable
- Brazil: deepwater and growing, but not a swing producer
- OPEC, OPEC+, and the producers outside the quota system
- Spare capacity: why it matters more than current output
- Why geography matters as much as production volume
- How production changes reach UK pump prices
- What production news actually means for a UK driver
Three countries, the US, Saudi Arabia, and Russia, produce more oil than any others. Together with the wider OPEC+ group they have significant influence over the global crude price. But production volume alone does not explain market power. What a country produces from, how quickly it can adjust output, how cheaply it can extract each barrel, and where that oil has to travel all shape how much influence a producer actually has over what you pay at the forecourt.
This article explains who produces what, what kind of oil they produce and why that matters, how OPEC+ and non-aligned producers interact, and what the pattern means for UK pump prices.
Key takeaways
- The US, Saudi Arabia, and Russia are consistently the three largest producers, though rankings vary by measurement basis (crude only vs total liquids).
- The type of production matters as much as the volume. US shale responds to price signals within months; Saudi conventional fields have the lowest extraction costs and the most spare capacity; Canadian oil sands are expensive and slow to ramp.
- OPEC+ accounts for a large share of global supply and sets production quotas. The US and Canada operate outside that quota system, while Brazil participates in OPEC’s Charter of Cooperation but not in the production-cut framework.
- Geographic position can override production rankings. Iran is not a top-three producer, but its position on the Strait of Hormuz matters far beyond its own output. Before the war began on 28 February 2026, around 20 million barrels a day of crude and oil products moved through the strait.
- North Sea production does not insulate UK drivers from global price movements. The UK is still a significant producer by European standards, but it is not among the leading global producers, and its crude enters the global market at globally determined prices.
How much do different countries actually produce, and how is it measured?
Oil production statistics are published in different ways by different bodies. The most commonly cited measure is barrels per day (b/d) of crude oil. The EIA also publishes rankings for total oil, or petroleum and other liquids, which include crude oil, other petroleum liquids, biofuels, and refinery processing gain. That broader measure produces higher totals, especially for the United States, because US shale output also generates large volumes of natural gas liquids.
On a crude-only basis, the gap between the United States, Saudi Arabia, and Russia is narrower than it is on a total-liquids basis. But on current official annual data the United States remains the world’s leading crude oil producer, while on total-liquids rankings it is also clearly first.
Top producers by approximate output on the EIA’s total-oil measure, which includes petroleum and other liquids rather than crude oil alone. Source: U.S. Energy Information Administration, “What countries are the top producers and consumers of oil?” Source published 11 April 2024, covering 2023 output. Rankings can shift over time, so this table should be read as a sourced snapshot rather than a live 2026 leaderboard. Note on freshness: the production table below is an annual snapshot based on official 2023 EIA data. Output figures reflect 2023 volumes, while membership/alignment labels and the sections discussing Hormuz, OPEC/OPEC+, and the 2026 war are updated through 6 May 2026.
Rank | Country | Approx. output (b/d) | Current status / alignment (May 2026) | Production type and why it matters |
|---|---|---|---|---|
1 | United States | 21.91 million b/d | Non-aligned | Shale + NGL-heavy liquids mix; responds to price signals relatively quickly; partial OPEC+ counterbalance |
2 | Saudi Arabia | 11.13 million b/d | OPEC (leader) | Conventional onshore; largest spare capacity; pivotal OPEC producer |
3 | Russia | 10.75 million b/d | OPEC+ (non-OPEC signatory) | Conventional; large pipeline and seaborne exports; key non-OPEC participant in OPEC+ |
4 | Canada | 5.76 million b/d | Non-aligned | Oil sands + conventional; high cost, slow to ramp; historically pipeline-constrained, though export access improved after TMX entered service in May 2024 |
5 | China | 5.26 million b/d | Non-aligned | Mixed onshore/offshore; mostly for domestic use; also the world’s largest importer |
6 | Iraq | 4.42 million b/d | OPEC | Conventional; exports heavily exposed to Gulf shipping routes |
7 | Brazil | 4.28 million b/d | CoC participant (outside production-cut framework) | Deepwater pre-salt; growing output, but not a swing producer |
8 | United Arab Emirates | 4.16 million b/d | Former OPEC/OPEC+ member (left 1 May 2026) | Conventional; meaningful spare capacity; partial Fujairah bypass reduces, but does not remove, Hormuz dependence |
9 | Iran | 3.99 million b/d | OPEC | Conventional onshore + offshore Gulf; chokepoint geography matters beyond output |
10 | Kuwait | 2.91 million b/d | OPEC | Conventional; exports largely dependent on Gulf shipping routes |
A quick caution on rankings: this table uses the EIA’s broad “petroleum and other liquids” measure, not crude oil alone. If you compare it with crude-only league tables, the order and the reported totals can look different.
Measurement basis: total oil (petroleum and other liquids), including crude oil, all other petroleum liquids, biofuels, and refinery processing gain. This is broader than a crude-only ranking, which is why the order and the reported totals can differ from other league tables.
Where the UK fits. The UK is a significant producer by European standards but not in the global top 10. North Sea oil production peaked in 1999 and has trended down over the long run, despite occasional short-lived rebounds. UK crude enters the global market at globally determined prices, not at a domestic discount. This is why UK production does not translate into lower pump prices.
What each producer extracts, and why the type of oil matters for prices
Not all oil production is equal. The type of reservoir, the extraction cost, the lead time to bring new wells online, and the export infrastructure all determine how a producer interacts with the market. Understanding these differences explains why some producers can respond to price signals within months while others take years, and why some can remain profitable at much lower oil prices than others.
United States: shale and the price-responsive producer
The dramatic growth in US oil output over the past 15 years came overwhelmingly from shale formations, particularly the Permian Basin in west Texas and New Mexico. Shale wells are drilled relatively quickly (weeks to months rather than years for conventional deepwater projects) and can be brought online or shut in more responsively as prices change. This is the mechanism behind the US shale “price ceiling” effect: when crude prices rise, more shale wells become economic, and US output increases. When prices fall, drilling slows. The response is not instant (it takes months, not days) but it is significantly faster than conventional megaproject timelines. The US also produces large volumes of natural gas liquids from the same shale operations, which is why US total liquids output exceeds crude-only figures by a wide margin.
Saudi Arabia: low cost, spare capacity, and the swing producer
Saudi Arabia’s production comes primarily from very large conventional onshore fields. Ghawar, in the eastern province, is one of the world’s largest and most productive oil fields. Saudi extraction costs are among the lowest globally. This is why Saudi Arabia can produce profitably at price levels that would squeeze shale producers and oil sands operators much harder. It is also why Saudi Arabia can afford to hold spare capacity: keeping wells below maximum output costs relatively little when the per-barrel cost is so low. That spare capacity, the ability to increase output by a significant amount at short notice, is the single most important feature of Saudi Arabia’s market position.
Russia: pipeline-dependent and hard to reroute
Russian production centres on the vast West Siberian basin, with additional output from the Urals-Volga region and newer fields in East Siberia and the Arctic. Russia’s exports are heavily pipeline-dependent: the Druzhba pipeline system carries crude westward to European refineries, while the ESPO (Eastern Siberia-Pacific Ocean) pipeline carries crude eastward to Asian buyers. This infrastructure rigidity is why the 2022 sanctions on Russian oil reshaped European energy flows rather than simply removing Russian barrels from the market. Russian crude that could no longer reach Europe by pipeline was rerouted by tanker to Asian buyers, but the adjustment took months and involved discounted pricing to attract new customers.
Canada: oil sands and the slow responder
Canada’s production growth has come primarily from oil sands deposits in Alberta. Oil sands extraction is expensive and slower to respond to price signals than shale. Canada was long constrained by export pipeline capacity, but the Trans Mountain Expansion entered commercial service on 1 May 2024, increasing access to tidewater and overseas markets. Even so, Canadian output still does not respond to price signals the way US shale does: new oil sands capacity takes years to build and requires sustained high prices to be economic.
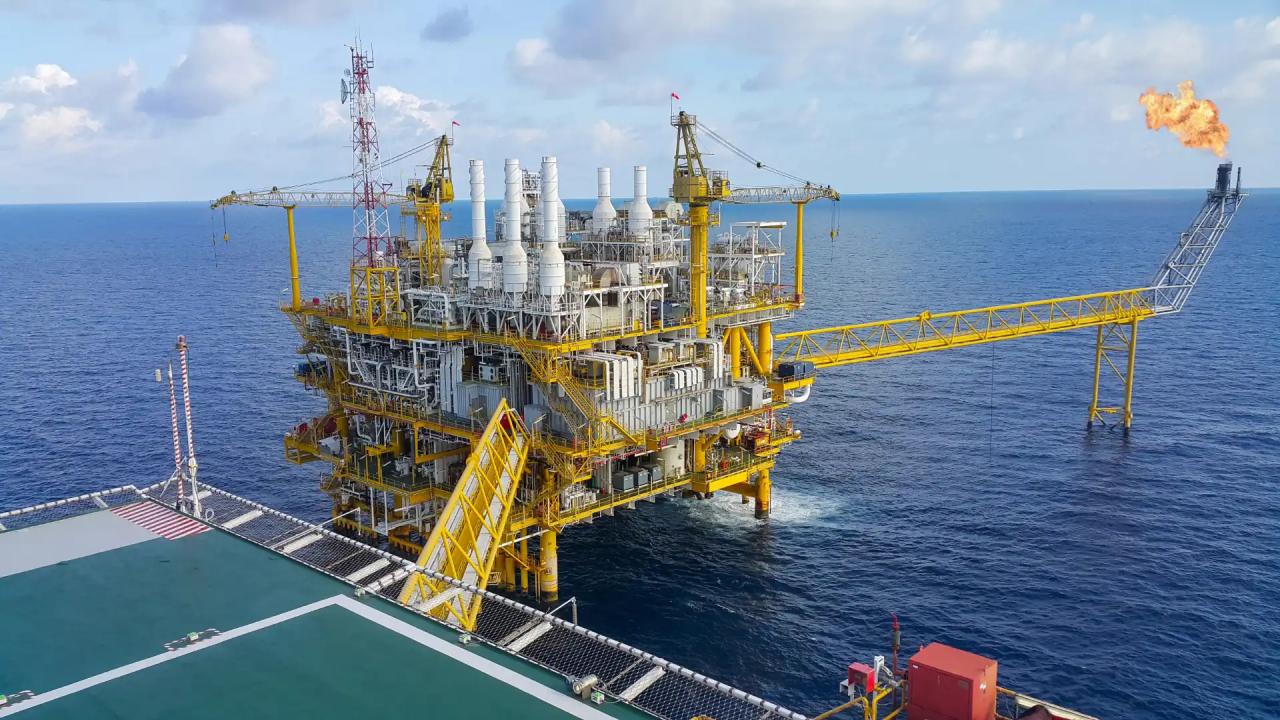
Gulf producers: Hormuz-dependent and chokepoint-vulnerable
Iraq and Kuwait export overwhelmingly through terminals inside the Persian Gulf, while the UAE remains heavily exposed to the Strait of Hormuz even though it has a partial bypass route to Fujairah on the Gulf of Oman. Iran’s crude exports are concentrated at Persian Gulf terminals, especially Kharg Island.
Since the war began on 28 February 2026, flows through the Strait of Hormuz fell from around 20 million barrels a day before the war to just over 2 million barrels a day in March, and shipping remained severely disrupted into early May 2026. Reuters reported on 6 May that traffic had effectively halted over the previous 24 hours. That hit much more than Iran’s own exports: it constrained the main export route for Iraq, Kuwait, the UAE and a significant share of Saudi exports. Saudi Arabia and the UAE have operational bypass pipelines, but only enough to reroute part of normal volumes. Qatar is especially important here as an LNG exporter rather than a major oil producer, but its energy exports are also highly exposed to the same chokepoint.
For the full analysis of how chokepoints and shipping routes work, our article on how oil is transported and why chokepoints matter covers the infrastructure.
Brazil: deepwater and growing, but not a swing producer
Brazil’s output growth comes from deepwater pre-salt fields off the southeast coast. These are technically complex, expensive to develop, and have lead times measured in years from discovery to production. Brazil’s output is growing and is significant in absolute terms, but it does not respond to short-term price signals. It is a structural addition to global supply rather than a responsive one.
OPEC, OPEC+, and the producers outside the quota system
OPEC. The Organisation of the Petroleum Exporting Countries was founded in 1960 by five members (Saudi Arabia, Iran, Iraq, Kuwait, and Venezuela). Its purpose was to coordinate production policy to manage global crude prices. OPEC’s core in market terms remains the Gulf states, led by Saudi Arabia. As of 6 May 2026, the UAE has left OPEC and OPEC+, effective 1 May 2026.
OPEC+. In 2016, OPEC entered into a production coordination agreement with major non-OPEC producers, principally Russia. This expanded production-management framework accounts for a substantially larger share of global supply than OPEC alone. On 3 May 2026, the countries making the latest additional voluntary adjustment were Saudi Arabia, Russia, Iraq, Kuwait, Kazakhstan, Algeria, and Oman.
Charter of Cooperation (CoC). The CoC is a broader dialogue framework linking OPEC members and cooperating producers. Brazil joined the CoC in February 2025, but it is not part of the production-cut framework.
Not every OPEC member is equally constrained by the agreement: Iran, Libya, and Venezuela have often been exempt from the production-cut framework, so headline OPEC+ policy does not always translate into equal output changes across all members.
Directional comparison only. Exact shares vary depending on whether you use crude-only or total-liquids definitions and on the year selected.
Category | Key members | Indicative scale | Price influence |
|---|---|---|---|
OPEC | Saudi Arabia, Iraq, Kuwait, Iran, Venezuela, and others | Large coordinated share | Direct: coordinates production quotas |
OPEC+ (non-OPEC signatories) | Russia, Kazakhstan, Oman, Azerbaijan, Bahrain, and other non-OPEC partners | Additional coordinated share | Coordinates with OPEC on quotas |
CoC participants outside the production-cut framework | Brazil | Single major producer | Participates in dialogue, not output caps |
Major producers outside the quota system | US, Canada, China, Guyana, Norway, UK | Large but fragmented share | Indirect: output responds to price signals; no quota system |
Why producers outside the quota system matter. The US, Canada, Guyana, Norway, and other producers outside the quota system respond mainly to market price signals rather than coordinated production targets. Brazil is a special case: it participates in OPEC’s Charter of Cooperation but not in the production-cut framework. The US shale sector is the most important counterbalance: OPEC+ production cuts can raise crude prices, but higher prices can also attract more US shale output, partly offsetting the cut.
That is one reason OPEC+ actions since 2016 have not automatically produced 1970s-style price effects. But it is not the only one. Demand conditions, inventories, spare capacity, sanctions, and emergency stock releases also shape how large the price move becomes. But the counterbalance is partial: producers outside the quota system cannot fully offset a major OPEC+ cut or a major supply disruption like the 2026 war-related disruption in and around the Strait of Hormuz.
Spare capacity: why it matters more than current output
Spare capacity is the amount of additional oil a country can bring online within 30 days and sustain for at least 90 days that is currently not being produced. Saudi Arabia holds the largest spare capacity of any producer, which is why its market influence exceeds what its current output alone would suggest. The UAE also holds meaningful spare capacity.
Since the war began on 28 February 2026, the disruption to flows through the Strait of Hormuz has sent crude prices sharply higher, with Brent moving above $125 per barrel in early May. Alternative export routes from Saudi Arabia and the UAE have helped cushion the shock where spare capacity and export capacity were available, and on 11 March 2026 the IEA coordinated a 400 million-barrel emergency stock release. Those buffers have moderated the shock, but they have not prevented a severe market disruption.
Case-study sources: IEA, “The Middle East and Global Energy Markets”; IEA, “Oil Market Report – April 2026”; IEA, “IEA Member countries to carry out largest ever oil stock release amid market disruptions from Middle East conflict” (11 March 2026); U.S. EIA, “Hormuz closure and related production outages are key drivers in EIA’s latest forecast” (7 April 2026); OPEC, “Saudi Arabia, Russia, Iraq, Kuwait, Kazakhstan, Algeria, and Oman adjust production and reaffirm commitment to market stability” (3 May 2026); Reuters reporting on the UAE exit (28 April 2026), market pricing (2 May 2026), and shipping disruption (6 May 2026).
For the full explanation of bypass pipelines, chokepoints, and shipping routes, see our article on how oil is transported around the world. For how markets reprice on disruption and what buffers exist, see our article on what happens when oil supply is disrupted.
Why geography matters as much as production volume
Production rankings tell you how many barrels a country pumps. They do not tell you how much market disruption can result when a key transit route is hit.
Iran is not a top-three producer, but it sits on the northern shore of the Strait of Hormuz, through which around 20 million barrels a day of crude and oil products moved before the war began on 28 February 2026. Because flows remained severely disrupted into early May 2026, the market impact has been far larger than Iran’s own production would suggest. Iraq and Kuwait produce significant volumes, but the vast majority of their exports depend on the same chokepoint. The UAE is somewhat less exposed because it can bypass part of its crude exports via Fujairah, while Saudi Arabia can reroute part of its exports westward. A rankings table alone does not capture this. The practical lesson: watch who produces the oil, but also watch where it has to travel.
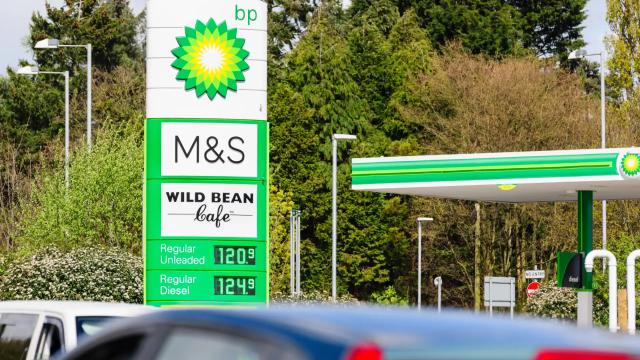
How production changes reach UK pump prices
Crude market pricing. When OPEC+ announces a production cut, crude oil futures markets typically reprice within hours. The market adjusts to the anticipated supply reduction, not just the actual one.
Refinery margin and refined product prices. After crude moves, refined product prices follow, but refinery margins add a variable layer. During the 2022 Russia-Ukraine crisis, margins widened significantly. The CMA documented this in its 2023 fuel retail market study.
Exchange rate. Crude is priced in US dollars. A weaker pound produces higher UK pump costs even if the dollar crude price is unchanged.
The CMA found clear evidence of rocket-and-feather pricing for diesel in 2023, but not clear evidence of the same pattern for petrol. For the full explanation, our article on why pump price increases are faster than decreases covers the CMA’s findings.
Local competition. Once the wholesale price has moved, the pace at which individual stations pass it on depends on local competition. For the fuller UK supply chain picture, our article on how UK crude production connects to the pump price you pay covers the North Sea context.
One important limit on how much crude moves translate into pump prices: at the time of writing, fuel duty is 52.95p per litre and VAT is charged at 20%, so changes in crude prices affect only part of the final litre price directly.
What production news actually means for a UK driver
An OPEC+ production cut is a genuine market signal that crude prices are likely to rise, and UK pump prices will usually follow over the course of a number of weeks rather than immediately. A chokepoint disruption is more severe and faster-acting, because it physically removes oil from transit.
US shale output moderates OPEC+ influence but does not offset it completely. The shale response takes months and involves investment decisions that are not instant. Canadian oil sands respond even more slowly. Exchange rate movement can amplify or reduce the crude price effect independently.
The practical response is not to rush to fill up before a cut takes effect. It is to check current local prices and use the cheapest available station. You can see what nearby stations are charging right now and act on the current picture.
Keep reading
UK Petrol Price History: The 2020–2026 Price Shocks, Record Highs, and What They Mean for Drivers Today
UK petrol prices went through more in six years than in the previous two decades. The collapse of 2020, the record-breaking surge of 2022, and the slow retreat that followed left p...
What Happens When Oil Supply Is Disrupted, and Why Prices Spike Before Any Shortage Reaches You
When an oil supply disruption makes the news, crude prices often move within hours. UK pump prices usually follow within one to three weeks, not because the petrol on UK forecourts...
How Oil Is Transported Around the World, and Why a Distant Disruption Can Raise Your Fuel Costs
Most of the world’s crude oil travels by sea, through a small number of narrow straits and canals that handle enormous volumes of daily trade. When any of those chokepoints is thre...
PetrolSavings Editorial
Editorial Team
Explore fuel savings tools
Use calculators and local price searches to plan smarter journeys.
Prices and station info are refreshed continuously. Look for freshness timestamps when comparing fuel deals.