What's in this article
- Why speed and fuel consumption are not in a straight line
- What the fuel difference looks like in pounds
- Why the effect varies so much between vehicles
- The headwind factor most articles ignore
- The time cost — the number most articles leave out
- When the saving matters most — and when it barely registers
- Common myths about speed and fuel economy
- The one thing that tells you more than this article can
The short answer is yes: driving at 60 mph on a motorway uses less fuel than driving at 70 mph. The underlying physics is straightforward and well established.
The longer answer concerns scale. The saving depends heavily on the car, the time lost is simple arithmetic, and whether the trade-off is worthwhile depends on the journeys you actually make.
Key takeaways
- Aerodynamic drag rises steeply with speed. Between 60 and 70 mph, the engine works disproportionately harder to maintain pace, which means measurably higher fuel consumption at 70 mph. This is physics, not opinion.
- The size of the effect varies significantly by vehicle. A large SUV or van pays a much larger aerodynamic penalty at higher speeds than a low-slung hatchback. Without a sourced figure for your specific car, treat published percentage claims with scepticism.
- Driving at 60 mph instead of 70 on a 200-mile motorway trip adds roughly 29 minutes. That time cost is real and worth weighing alongside any fuel saving.
- A headwind amplifies the drag effect. At 70 mph into a 15 mph headwind, the car is pushing through air at the equivalent of roughly 85 mph in still conditions.
- The saving matters most on long, sustained motorway runs — not short sections or congested routes where average speed sits well below 70 mph regardless.
Why speed and fuel consumption are not in a straight line
At low speeds, especially in town driving and stop-start traffic, fuel use is dominated by acceleration from rest, idling and drivetrain losses. Aerodynamic drag barely features. As speed rises, drag becomes increasingly significant. Above roughly 50–55 mph on a flat road, it is typically the largest single energy demand the engine faces.
The reason drag rises so sharply at higher speeds lies in the physics. Drag force grows with the square of speed: at 70 mph the car pushes against roughly 36% more air resistance than at 60 mph. But the engine does not just have to overcome the force, it has to sustain that effort while moving forward, continuously. The power required grows with the cube of speed. Going from 60 to 70 mph is a 17% increase in speed, but the power the engine must deliver rises by a considerably larger proportion.
The practical result: fuel consumption is meaningfully higher at 70 mph than at 60 mph. The direction is certain. The exact amount depends on the car.
What the fuel difference looks like in pounds
On the fuel side, the physics strongly suggests that most cars will return better fuel economy at 60 mph than at 70 mph. The saving on a 200-mile motorway run is likely a few pounds at current petrol prices. The exact figure depends on your car, your load, the wind and the gradient. Check your trip computer on a comparable journey to see the real number for your vehicle.
To frame it in pounds: at 142p per litre, each litre saved is worth 142p. As an illustrative example, if a mid-size petrol hatchback saves around 2 litres over a 200-mile motorway run by cruising at 60 mph rather than 70 mph, the saving per trip is approximately £2.84. Make that trip weekly and the annual saving is around £148.
Illustrative, based on an estimated 2-litre saving per 200-mile motorway run in a mid-size petrol car. Real-world figure varies by vehicle. Petrol price as of March 2026 (UK average unleaded).
On a shorter stretch, a 50-mile commuter motorway section, the absolute saving per trip is smaller and the time difference is about 7 minutes. Whether that arithmetic works for a daily commute is a different calculation entirely.
Why the effect varies so much between vehicles
Aerodynamic profile is the biggest variable. A large SUV, a van, or a car with a roof box has a significantly larger frontal area and drag coefficient than a sleek hatchback. The drag penalty at 70 mph versus 60 mph is correspondingly larger for these vehicles.
Gearing matters more than most drivers realise. A car that sits comfortably in top gear at 60 mph but drops a ratio at 70 mph will show a disproportionate fuel cost jump at the higher speed. Modern automatics may shift less obviously, but their torque converter behaviour still changes.
Engine type plays a role. Diesel engines are generally more efficient at sustained motorway speeds than petrol equivalents, partly because of how diesel combustion works at partial load. Hybrid cars are a different case: on a sustained flat motorway, electric assist is largely irrelevant and the petrol engine runs conventionally. The efficiency advantage hybrids offer in stop-start driving does not carry over.
Load, passengers, luggage, a full boot, increases energy demand at any speed and raises rolling resistance across the board, not just at higher speeds.
The headwind factor most articles ignore
Aerodynamic drag depends on the speed of the air relative to the car, not the car’s speed over the ground alone. In a headwind, the effective aerodynamic speed is higher than the speedometer reads.
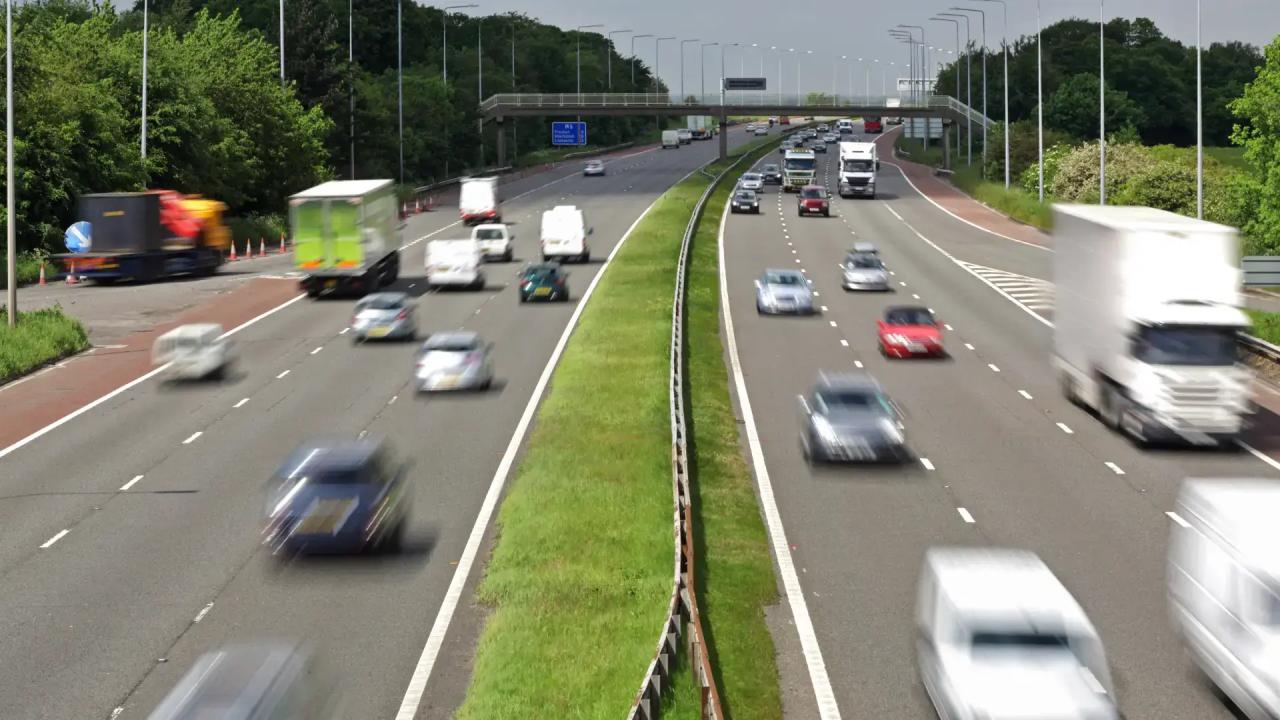
At 70 mph into a 15 mph headwind, the car is aerodynamically equivalent to one doing 85 mph in still air. The drag force rises accordingly. On exposed UK motorways, the M5 across the Somerset Levels, the A1(M) through County Durham, the M62 over the Pennines, headwinds are common in autumn and winter. In those conditions the case for easing back to 60 mph is noticeably stronger, because the aerodynamic penalty at 70 mph is disproportionately larger.
If your fuel consumption seems worse on a particular run than usual, check whether it was a headwind day before concluding the car is at fault.
The time cost — the number most articles leave out
Driving at 60 mph instead of 70 adds journey time in direct proportion to distance. The arithmetic is simple and the numbers are not trivial.
Motorway distance | Time at 70 mph | Time at 60 mph | Time added |
|---|---|---|---|
50 miles | 43 min | 50 min | ~7 min |
100 miles | 1h 26m | 1h 40m | ~14 min |
200 miles | 2h 51m | 3h 20m | ~29 min |
300 miles | 4h 17m | 5h 00m | ~43 min |
Assumes free-flowing motorway with no traffic delays.
On a 200-mile run, the difference is roughly half an hour. On a weekly long commute, that is half an hour each way, each week. This article is not going to tell you whether that trade-off is worth it. That depends entirely on what your time is worth to you.
When the saving matters most — and when it barely registers
The fuel difference between 60 and 70 mph is most significant on long, sustained motorway runs of 150 miles or more on a clear road, in high-sided or large-profile vehicles, and in headwind conditions. Drivers who make the same long motorway trip repeatedly benefit most, because the savings compound over the year.
It matters much less on short motorway sections as part of a mixed journey, on congested motorways where average speed is well below 70 mph anyway, and in aerodynamically efficient small cars where the absolute saving is smaller even though the proportional relationship still holds.
Common myths about speed and fuel economy
“There’s an exact sweet spot at 56 mph”
The 56 mph optimal figure appears in older fuel economy advice and has entered received wisdom. It is not a universal truth. The speed at which a particular car achieves its best economy on a flat road depends on its gearing, engine characteristics and aerodynamic profile. For some vehicles it may be around 55–60 mph; for others lower. The direction is consistent, economy tends to improve as you slow from 70 towards the 55–60 mph range, but the specific number varies.
“Driving at 60 saves around 25% compared to 70”
Specific percentage claims circulate widely and are frequently unsourced or based on tests of a single vehicle under specific conditions. The direction is correct: 60 mph does use less fuel. The quantum varies by vehicle. If you see a specific percentage, check the source. What vehicle? What conditions? When was it measured?
“Speed does not matter on motorways — it is town driving that uses the fuel”
True at lower speeds, not true at motorway speeds. In urban driving, stop-start cycles and acceleration from rest dominate fuel consumption. On a sustained motorway cruise above 60 mph, aerodynamic drag is typically the largest energy demand. The character of fuel use genuinely changes with speed regime.
“Modern cars are so efficient the difference is negligible”
Modern engine management, variable valve timing and improved aerodynamics have reduced absolute fuel consumption at any given speed compared to older cars. But they have not changed the underlying physics. Drag still rises with the square of speed and power demand with the cube. A modern car uses less fuel at 70 mph than its 2005 equivalent, but it still uses more at 70 than at 60 in the same proportional relationship.
The one thing that tells you more than this article can
The most reliable answer to how much speed affects your fuel economy is your own trip computer, on your own car, on a familiar route. Drive a 100-mile motorway run at 60 mph on one trip and 70 mph on another, under comparable conditions, similar weather, similar load, same fuel. Note what the trip computer reports at the end.
This is not a perfect experiment. Conditions vary. But it is more useful than any general percentage, because it is specific to your vehicle, your engine, your gearing and your road. Most modern cars display trip-average fuel consumption, and the difference between a 60 mph and a 70 mph run is large enough to show clearly in the figures.
Even if the mpg improvement at 60 mph is modest for your car, combining it with finding cheaper fuel before the journey maximises your total saving. Find the cheapest petrol on your route before you leave, the combined benefit from both habits is larger than either alone.
Routes and landmarks
Jump straight to route planning or landmark fuel pages while you read.
Keep reading
What Is a Good Petrol Price in the UK?
A good petrol price is one that is competitive for your area and station type, not just low against a national headline average. A price that looks expensive in a competitive super...
Is Eco Mode Worth Using? What It Actually Changes and When It Helps
Eco mode does save fuel. The changes it makes are real, and in the right conditions they produce a genuine if modest improvement in economy. The catch is that what Eco mode changes...
Does Engine Size Determine Fuel Costs? The Variables That Actually Matter More
Engine size does affect fuel consumption, and larger engines often use more fuel on average. But it is one of the weaker predictors of real-world running costs. Vehicle weight, dri...
PetrolSavings Editorial
Editorial Team
Explore fuel savings tools
Use calculators and local price searches to plan smarter journeys.
Prices and station info are refreshed continuously. Look for freshness timestamps when comparing fuel deals.